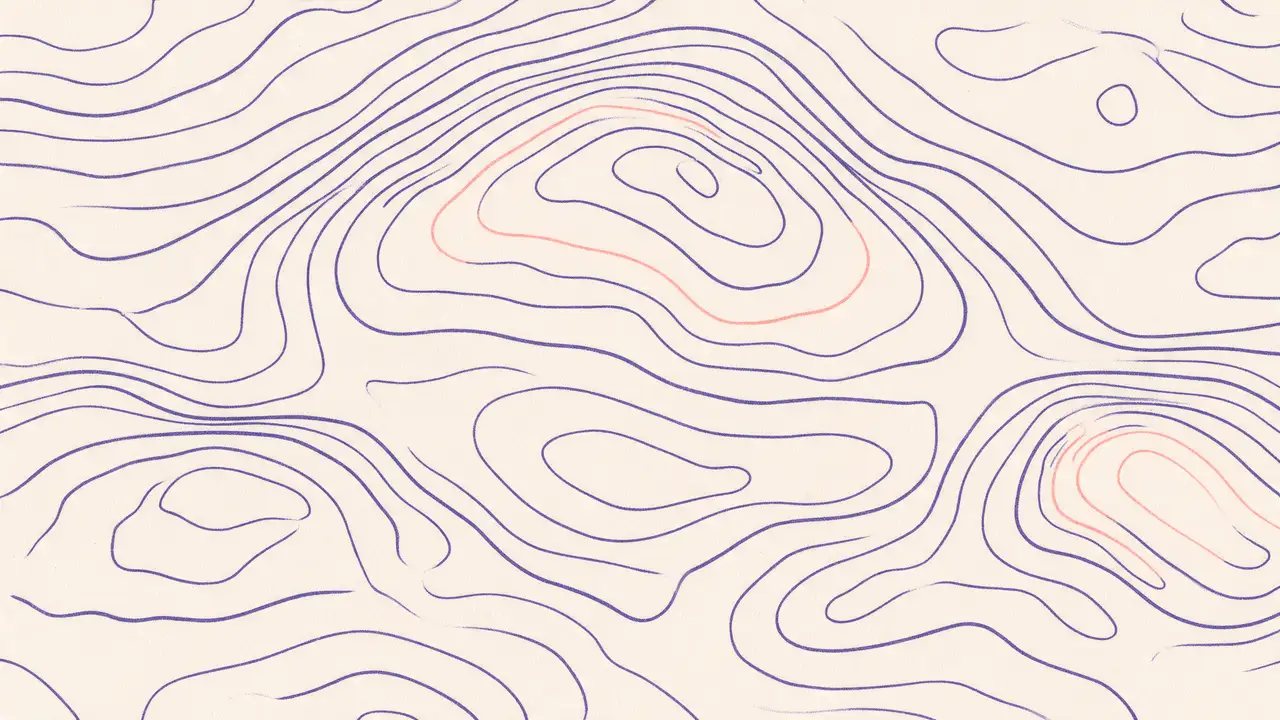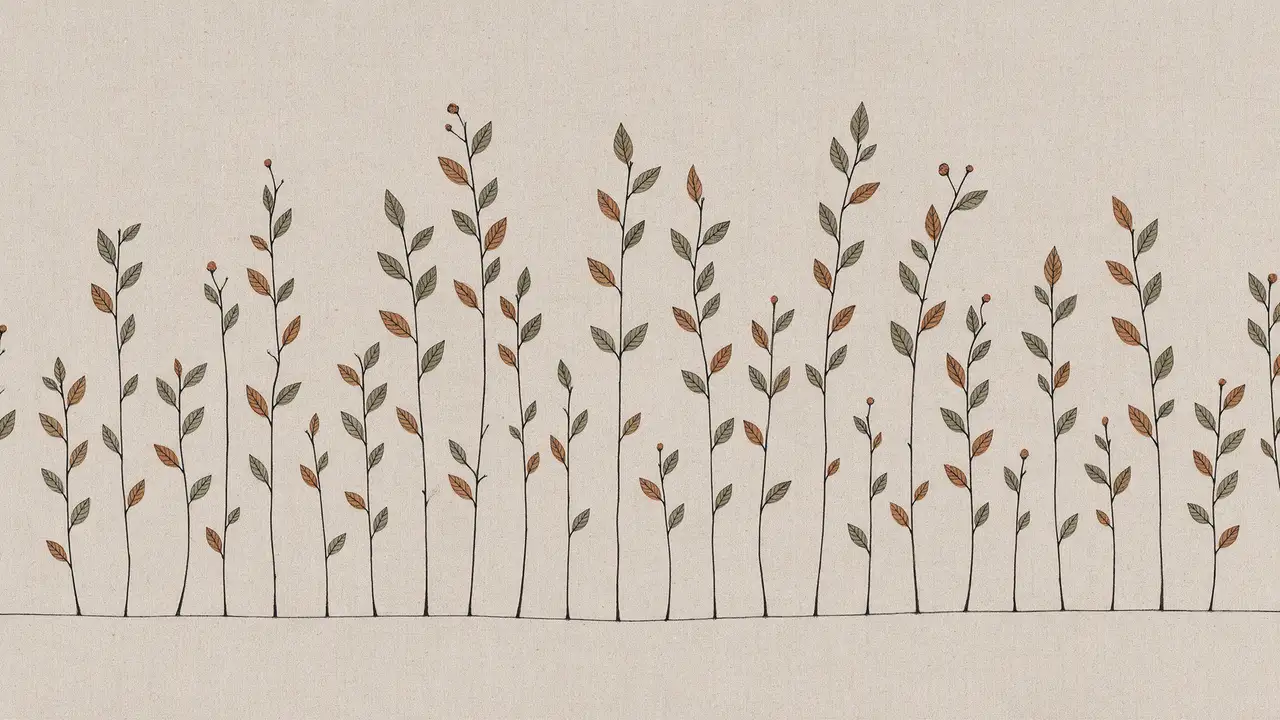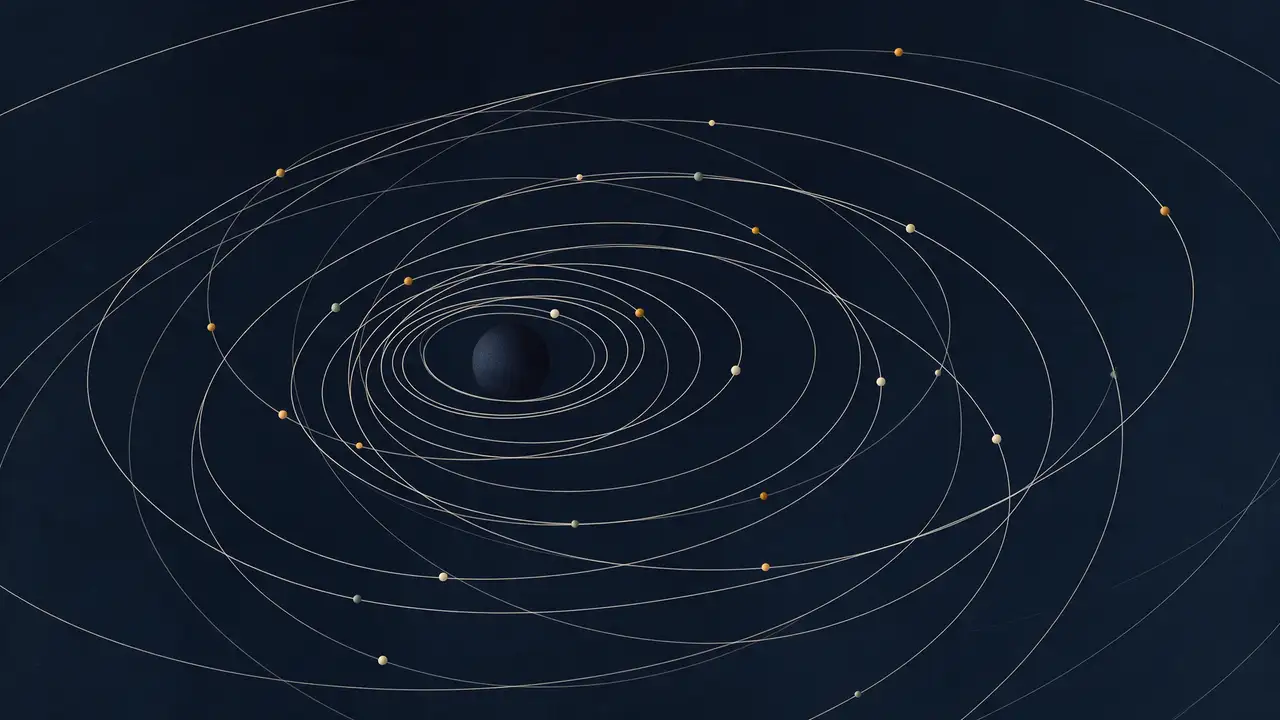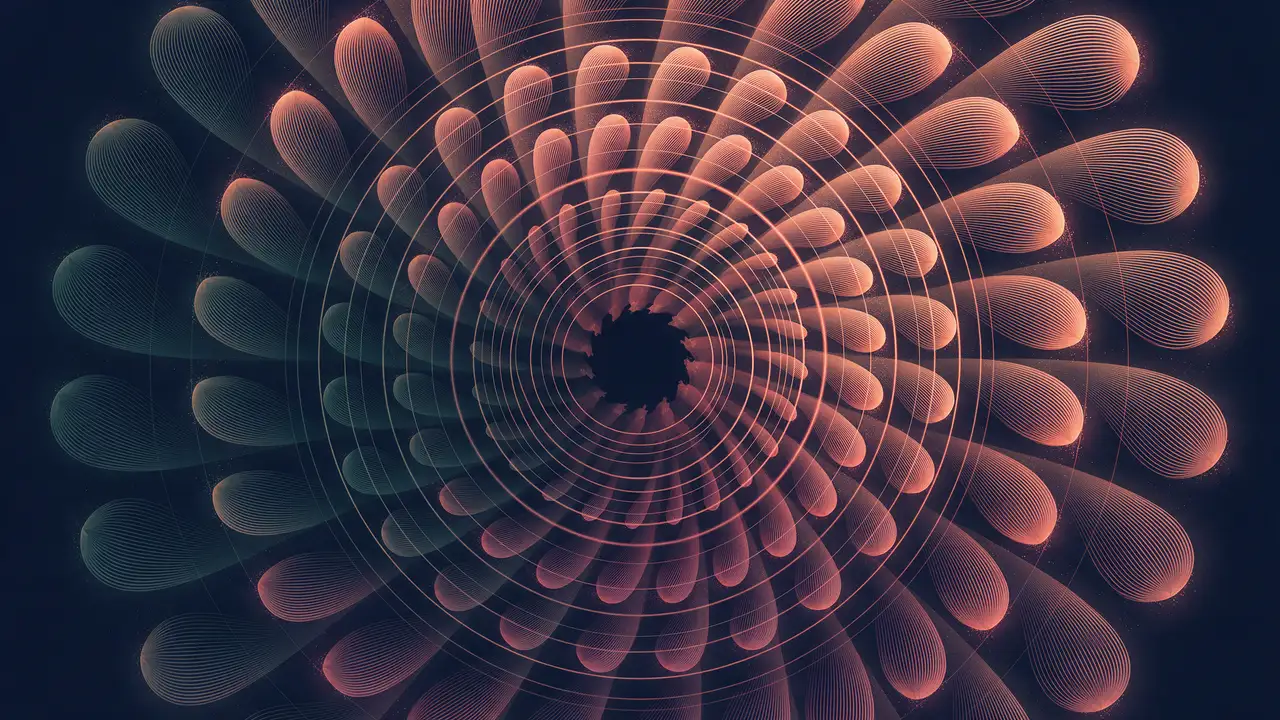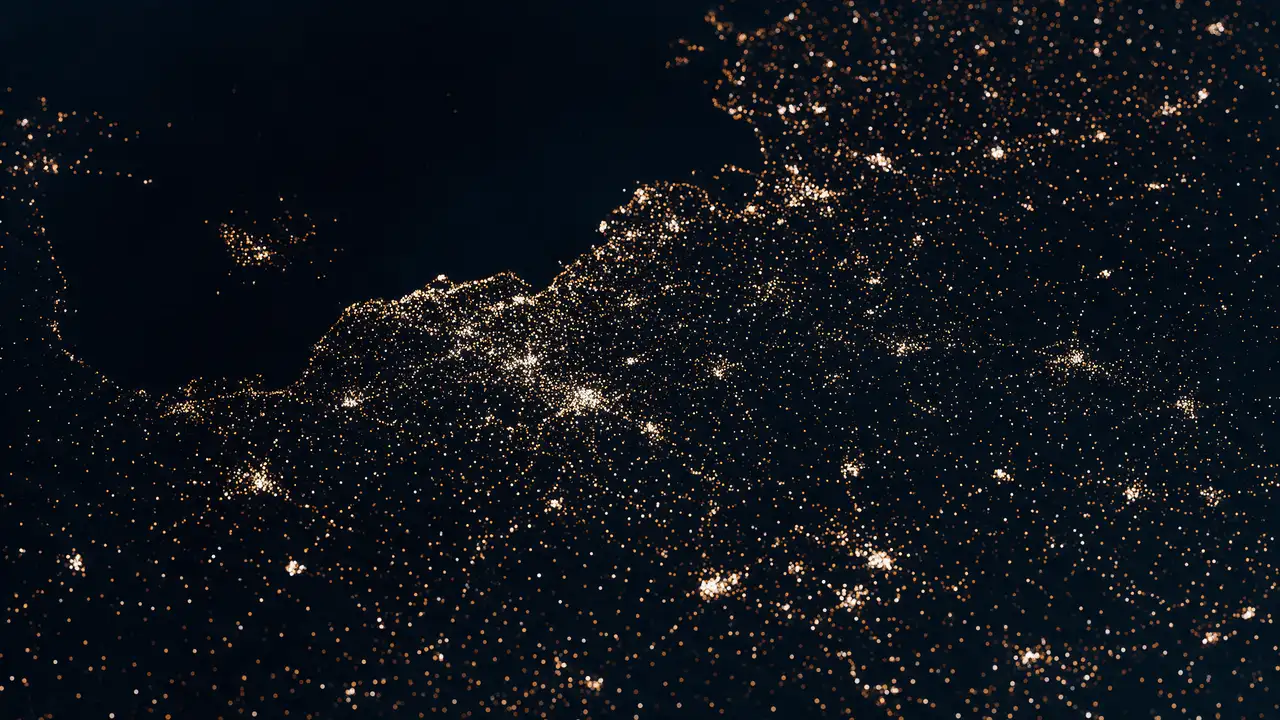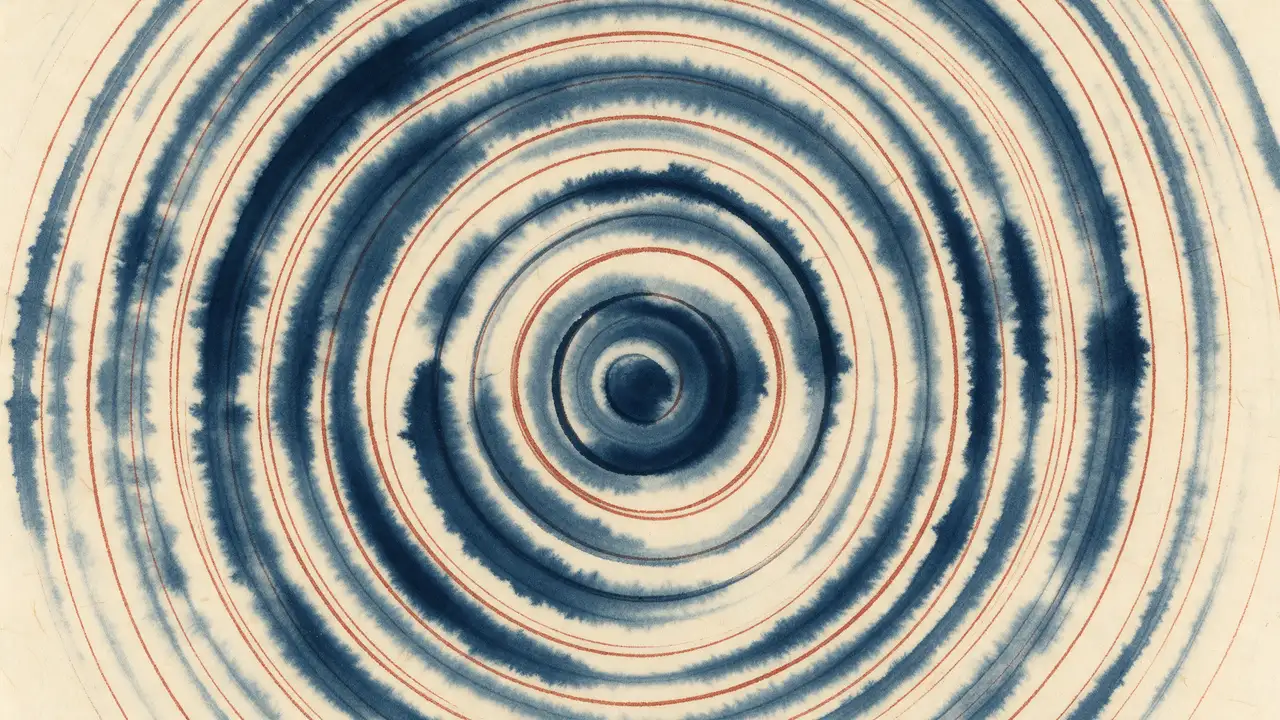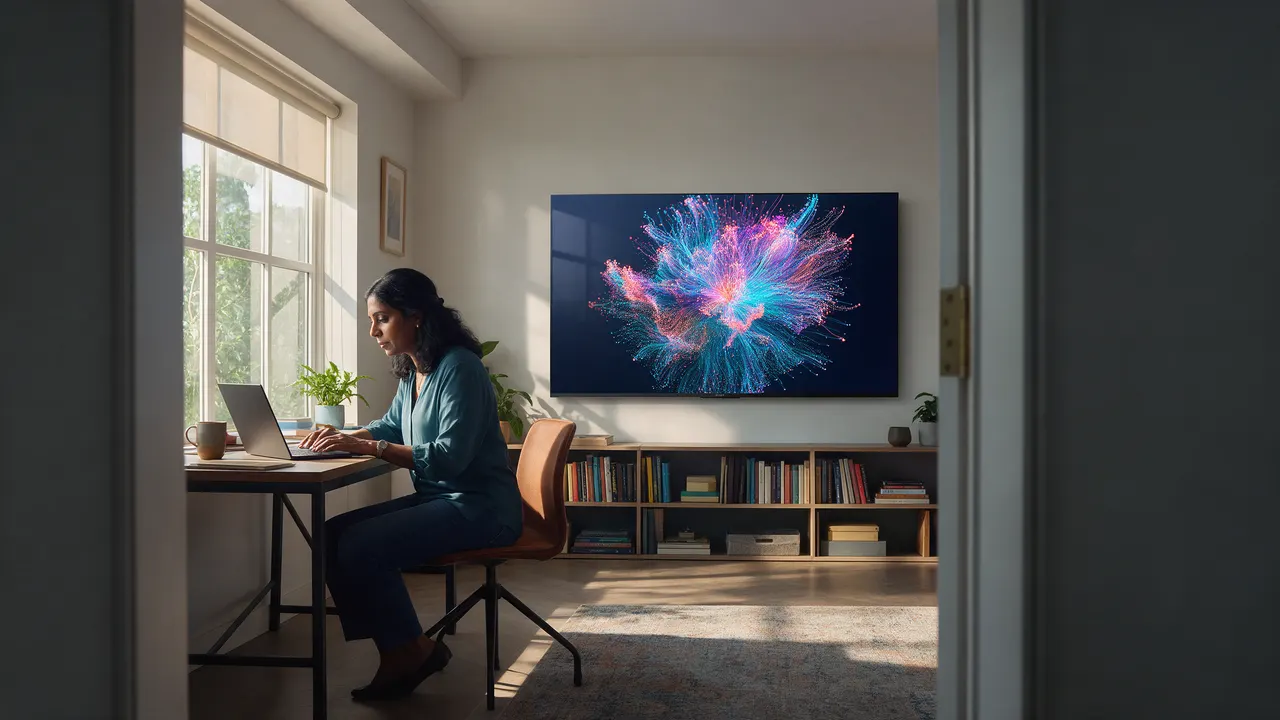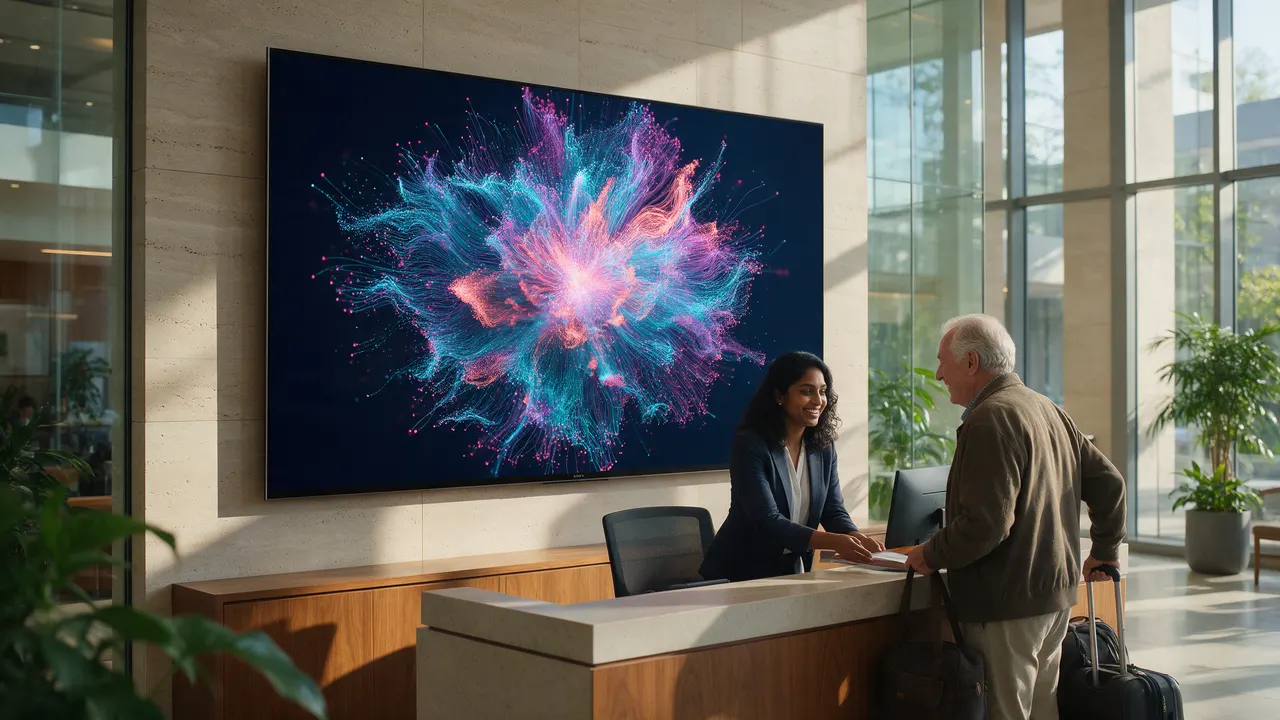
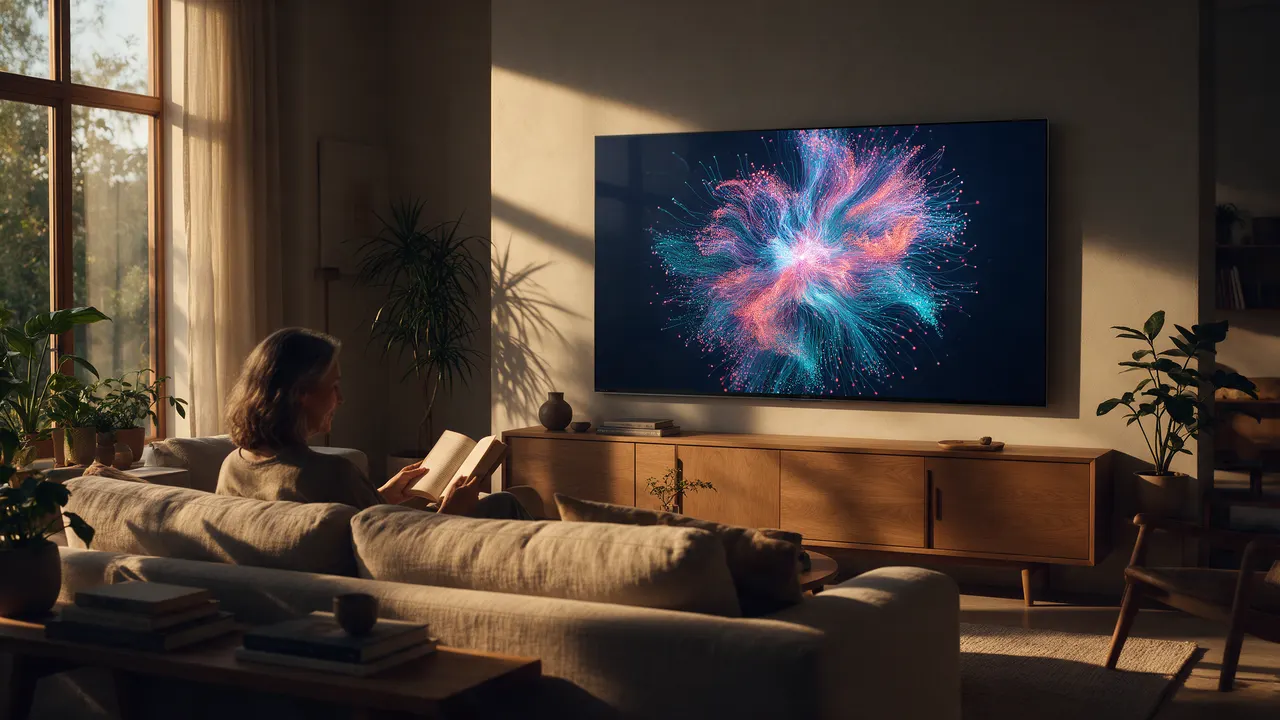
Generated illustration. A living room in late light. A thin black screen above a credenza. The glass is covered by the picture drawn on this page.
Generated illustration. The same living room. With scripts off, the photograph’s own picture stays on the glass.

0

Off the flow

36

Still in the flow

6

Bunched, the right

+11

Minutes, the commute

Counted from this picture. 36Sample.

Sample

Data in. Art out.

Living art, driven by your data.

RemoteLiving room

Data

View

Out of whack: the commute is slow.

Sample simulation. Not your network and not a channel. Keys 1, 2 and 0 work while this block is focused.

A picture actually wortha thousand words

A constant data stream goes in, art comes out, and when something gets out of whack, the art changes.

How it works

weatherforecastserversuptimesalestodayReticular cloudone placecalendarnext upfleetpositionsmenuspecials
Sample

How it works, step by step

In four steps

From your data to your wall.

01

Connect your data.

Start with the feeds you already watch: the weather, your servers, today’s sales, the calendar, the fleet. Switch one on and it flows straight into the art. You never look at a chart.

Today you pick from feeds we carry. Connecting your own is coming.

See data sources

Sample

02

Pick the art.

Choose a picture from a growing library, made by data artists working with code and AI. Calm by default, and it changes where your data does.

Browse the Guide

Sample stills

03

Connect your TV.

Use the good TV you already own. No new box, no frame to buy. Open one short address on the set, and the picture arrives from your phone.

Our test set is a 43-inch Sony Bravia on Google TV.

How pairing works

Sample

Sample illustration

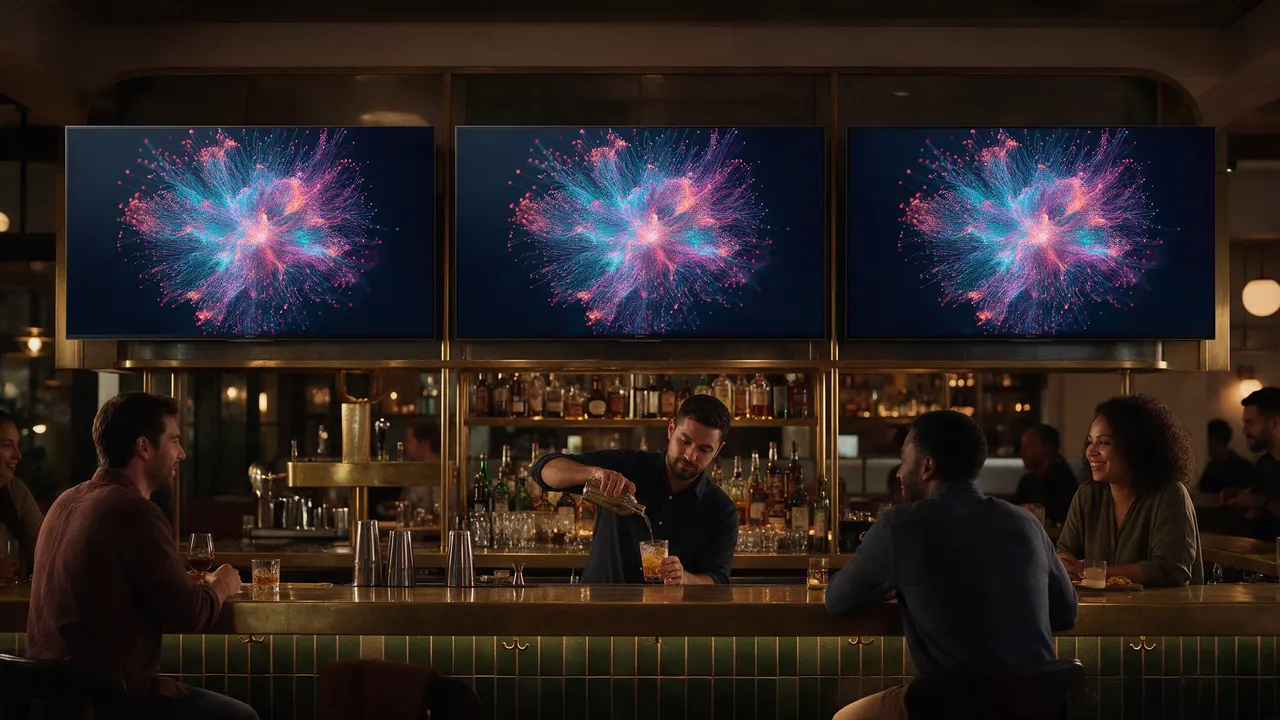
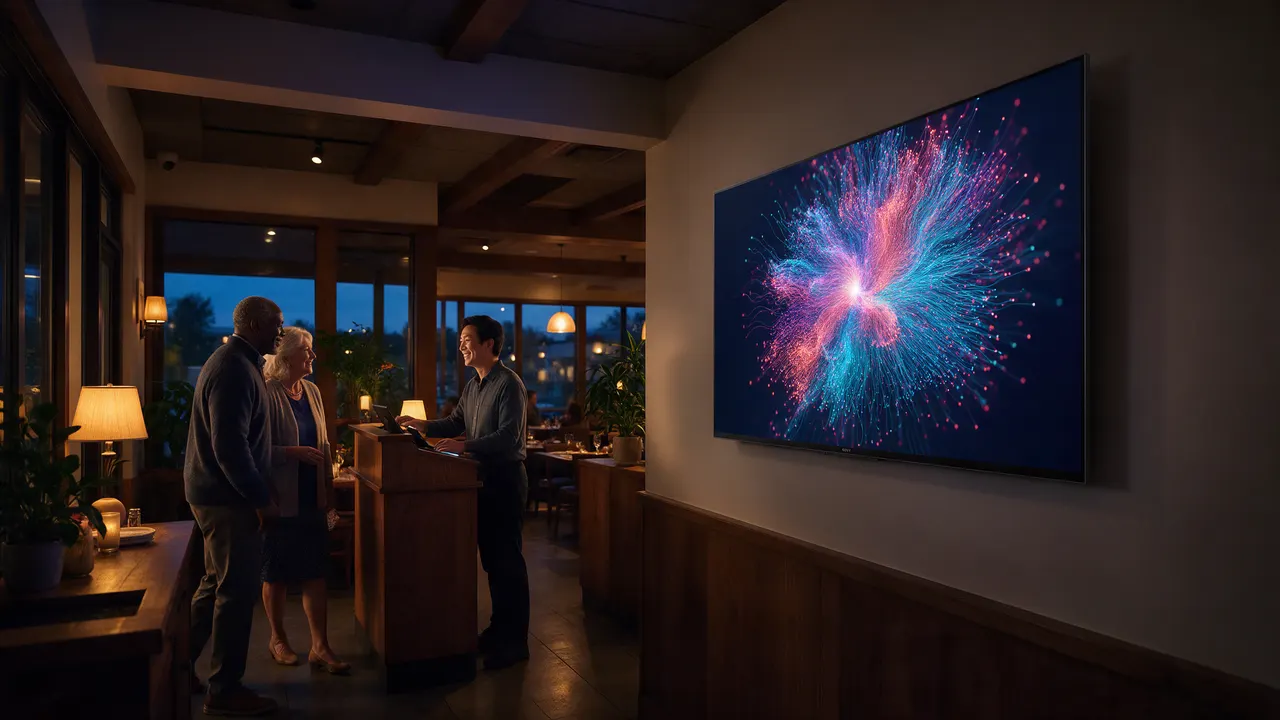
Generated illustration. A restaurant entrance at dusk. A thin black screen on the side wall.

Put living art on your wall.

The TV you already have. A picture that pays attention.

Reticular opens soon. Leave your email and we will tell you when.